
news
新闻中心
HER2 Gene Amplification in Breast Cancer
Abstract
International and national guidelines highlight the importance of accuracy, reproducibility, and quality control of in situ hybridization (ISH) methods for testing breast carcinomas. However, few guidelines cover the reporting of ISH cases with “unusual” signal patterns, including, eg, heterogeneity and loss of chromosome enumeration probe or gene signals. These cases are, in fact, relatively frequent, and there is a need for developing evidence- or consensus-based reporting guidelines to ensure consistency of treatment.
Following an audit of cases from a single center (including >1,700 cases) we show that approximately 10% of ISH results reflect unusual signal patterns. We illustrate the most common of these patterns and provide reporting guidelines for diagnosticians and recommendations for future research. Our goal is to ensure that in the future such “rogues” are reported in a consistent manner that, ultimately, will be supported by molecular and biochemical evidence.
HER2 gene amplification has been recognized for many years as a poor prognostic indicator in early breast cancer. More recently, with the introduction of HER2-targeted therapies, in particular trastuzumab (Herceptin), HER2 status has become a critical component in selecting the best treatment options in early and advanced breast cancer.1–3 The use of fluorescent in situ hybridization (FISH) and other in situ hybridization (ISH)-based methods, eg, chromogenic and silver ISH, has become widely accepted as the “gold standard” for determining HER2 amplification status and, in most cases, provides a clear answer as to whether a case is amplified; however, there are small subsets of “unusual” cases that do not conform to conventional diagnostic guidelines and reporting procedures and provide significant interpretive difficulties.
The current gold standard for assessing HER2 amplification is to calculate the mean ratio of HER2/chromosome enumeration probe (CEP)17 in 20 to 60 cells with a mean ratio of greater than 2.0 classed as amplified and a ratio of less than 2.0 as HER2–.4,5 With our increasing experience with ISH come increasing numbers of cases that do not conform to the expected patterns described in publications and reporting guidelines. These raise questions about the underlying cytogenetic changes and their implications in determination of HER2 status. These anomalies take many forms and include heterogeneity, loss of signals, variations in signal size, and colocalization of HER2/CEP17 signals.
We recently updated the UK HER2 guidelines with a specific focus on the approaches to interpretation of HER2 gene amplification on ISH4 and also performed an audit of the impact of heterogeneous HER2 amplification,6 with information on the frequency and prognostic impact of different cutoffs for HER2 gene amplification. We recognize, however, that there are additional aspects of HER2 ISH interpretation that present diagnostic and interpretive challenges. An update to UK guidelines4 recommends that these difficult cases be analyzed by 2 observers. In the current study, we sought to identify the frequency and describe reporting of specific examples of challenging cases—the “rogues” that provoke intense discussion at multidisciplinary meetings. This article describes the most commonly occurring cases from this HER2 rogues gallery and provides recommendations on how these should be interpreted. Future reports may address less frequently occurring abnormalities.
It should be recognized that as with most guidelines, these recommendations reflect our expertise and are subject to change with emerging evidence. However, we are acutely aware that, for the majority of these unusual cases, representing in total almost 10% of HER2 breast cancers assessed by ISH, there is no likelihood of a robust evidence base (within the context of a clinical trial) that will determine treatment efficacy with HER2-directed therapies. There may be research questions that, in the future, further inform the interpretation of these cases, and, when these are likely to do so, we have made suggestions for such research.
Materials and Methods
During the past 24 months, we have performed an ongoing audit of cases on which ISH was performed at one of the busiest UK HER2 testing centers and reference sites. The Birmingham Heartlands Hospital Molecular Pathology Laboratory, Birmingham, England, acts as a local testing center, a referral center, and a UK National External Quality Assessment Service (NEQAS) reference center for HER2 ISH and immunohistochemical testing. With an annual HER2 immunohistochemical caseload in excess of 2,200 cases and an annual ISH caseload of more than 800 cases, this represents a significant pool from which to draw unusual cases. During the 24-month period in question, 1,787 cases were referred for ISH testing, and these form the basis of the current audit. By using HER2 FISH cases from this center, we have identified the frequency and specific examples of challenging or rogue cases. The images and results from these cases were then circulated to selected UK NEQAS reference laboratories, and a consensus diagnostic opinion was generated by consultation with molecular diagnosticians, cytogeneticists, and pathologists. We also draw recommendations for future research to further test and validate these diagnostic approaches.
Results
Heterogeneous HER2 Amplification
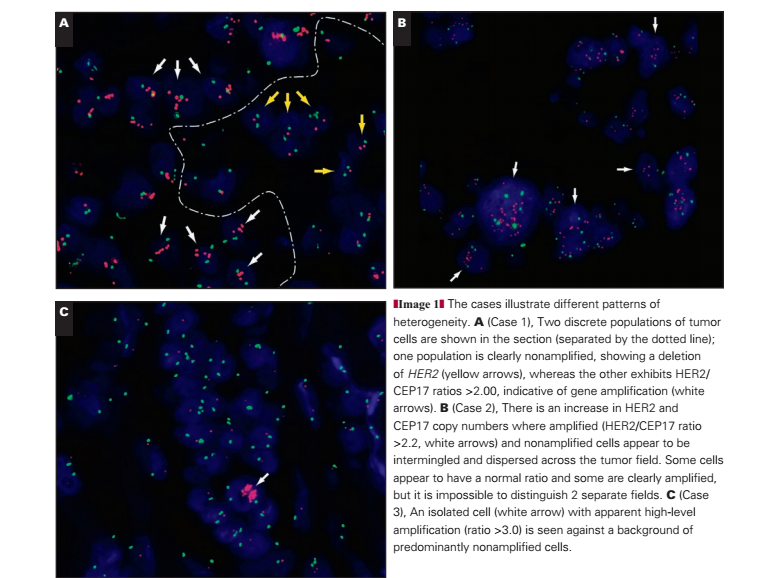
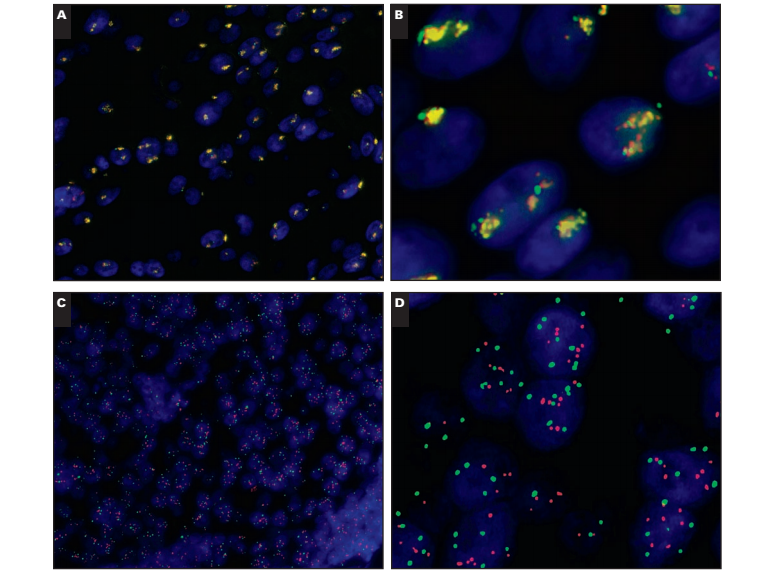
Of 1,787 audited cases 66 (3.7%) exhibited differing patterns of heterogeneous amplification. Specific patterns of heterogeneous amplification are illustrated in Image 1A, Image 1B, and Image 1C. For all cases exhibiting heterogeneous amplification on core biopsy, we would recommend repeating the ISH analysis on the resection specimen (when possible).
Case 1: Simple Heterogeneous Amplification
In this case, 2 discrete populations of tumor cells are represented within the tumor section, which may be immediately adjacent to each other (as illustrated in Image 1A) or within discrete tumor areas. One population is clearly non-amplified, whereas the other exhibits HER2/CEP17 ratios of more than 2.00, clearly indicative of gene amplification.
Scoring Recommendation.—Score at least 20 tumor cells from each area.
Interpretation.—This tumor contains 2 separate breast cancer clones, one of which exhibits HER2 gene amplification, and the other is nonamplified.
Reporting Recommendation.—Report this case as an HER2-amplified case exhibiting “heterogeneous amplification,” and provide HER2/CEP17 ratios for both populations on the case report.
Case 2: Complex Heterogeneous Amplification, “Intermixed” Amplified and Nonamplified Tumor Cells
In this case (Image 1B), the amplified and nonamplified cells appear to be intermingled and dispersed across the tumor field. Some cells appear normal and some clearly amplified, but it is impossible to distinguish 2 separate fields.
Scoring Recommendation.—Score 60 tumor cells across 3 areas, recording results for amplified and nonamplified cells on the same reporting sheet.
Interpretation.—This tumor contains intermixed breast cancer clones, one of which exhibits HER2 gene amplification, and the other is nonamplified.
Reporting Recommendation.—Report as a case exhibiting potential “intermixed heterogeneous amplification,” and provide the mean HER2/CEP17 ratio for all cells counted (or for individual fields without separating amplified/nonamplified cells). However, also report the percentage of amplified cells (with ratios >2.00) identified within the mixed tumor population, although recent data suggest small proportions of amplified cells do not imply HER2 amplification is present.6 For such cases, current guidance would be to report HER2 amplification only when the mean HER2/CEP17 ratio for all cells counted exceeds 2.00.
Case 3: Isolated Amplified Tumor Cells
In this case (Image 1C), there are isolated cells with apparent high-level (ratio >3.0) amplification in the tumor against a background of predominantly nonamplified cells. Caution should be applied to ensure that the signal in apparently amplified cells is genuine and does not reflect a processing artifact. Some artifacts may appear to mimic true signals but fluoresce across multiple wavelengths (ie, autofluorescence). Therefore, a check that these signals do not appear under 4′,6-diamidino-2-phenylindole, green, or aqua filters should be performed before they are scored. If these signals are genuine, they should be counted.
Image 1
Scoring Recommendation.—Amplified and nonamplified tumor cells should be scored within the fields selected without biasing the count toward amplified or nonamplified cells.
Interpretation.—This tumor may contain isolated tumor cells with HER2 amplification, the significance of which is unclear at present. However, current evidence suggests they have limited impact on prognosis. Their full significance remains poorly understood.
Reporting Recommendation.—Record the presence of isolated amplified tumor cells only when they are clearly amplified. The prognostic importance of such cells is unclear, but recent evidence suggests they do not impact on outcome if the proportion is small (<30%).6 Report the mean HER2/CEP17 ratio for all cells counted, and base the overall diagnosis (amplified or not amplified) on this ratio. This case, for example, would be regarded as not amplified for HER2.
Research Recommendation.—It is considered unlikely that sufficient evidence as to the prognostic impact of such isolated tumor cells can be obtained. Single-cell analysis might yield information on the biology of such cells (following laser capture microdissection) but would not clarify the impact on the future course of disease in patients.
Loss of Chromosome 17 Centromeric Signals (“Monosomy” or Loss)
In an audit of 1,787 cases, we identified 36 cases (2.0%) with apparent monosomy of chromosome 17, interpreted as a reduction in CEP17 signals on the ISH slide to less than 1.4 copies per cell.7 A further 10 cases (0.6%) exhibited loss of CEP17 signals without loss of HER2 signals. In total, 46 cases (2.6%) exhibited loss of CEP17 signals. In addition, 41 cases (2.3%) exhibited a greater number of CEP17 signals compared with HER2 (with an HER2/CEP17 ratio <0.8); a small proportion of these cases also exhibited high HER2 copy numbers. This may reflect loss of heterozygosity of HER2.
Case 4: Loss of Entire Chromosome 17
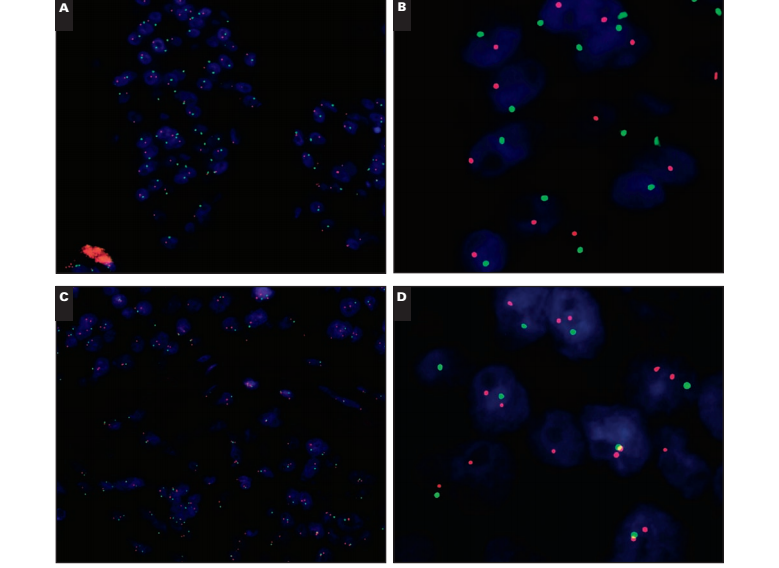
In this case Image 2A and Image 2B, only single signals for HER2 and chromosome 17 CEP signals are observed in the tumor cells across the entire field of view; essentially, it appears as if each cell is missing a region of or an entire chromosome 17. A critical check is that the adjacent normal cells still have 1 or 2 CEP17 and HER2 signals. The mean chromosome 17 CEP copy number is 1.02 (SD, 0.13), and the mean HER2 copy number is 1.06 (SD, 0.25); the HER2/CEP17 ratio is 1.05.
Scoring Recommendation.—Score according to the UK guidelines.
Interpretation.—Although the case is abnormal, this is a clear example of a nonamplified tumor.
Reporting Recommendation.—Report the case as non-amplified for HER2 with a potential addendum to the report of monosomy or deletion of chromosome 17.
Research Recommendation.—Comparative genomic hybridization (CGH) would allow the detection of subchromosomal regions of loss that might lead to the deletion of the HER2 and CEP17 loci.
Case 5
In this case Image 2C and Image 2D, there is a loss of the chromosome 17 CEP signal in the tumor cells (again with normal cells adjacent displaying a normal signal pattern). The loss or deletion is observed only for the CEP17 signal, with normal HER2 copy numbers. The result is borderline HER2 gene amplification with a mean HER2 copy number of 1.98 (SD, 0.62) and a mean CEP17 copy number of 1.02 (SD, 0.13); the HER2/CEP17 ratio is 1.95. Under UK guidelines, with 60 counted cells, this case would be regarded as “borderline but nonamplified” and under American Society of Clinical Oncology/College of American Pathologists3 guidelines as equivocal. The presence of 6 (10%) of 60 cells with an individual HER2/CEP17 ratio of 2.20 or more would mean that under current College of American Pathologists guidelines,8 this case would be regarded as exhibiting heterogeneous HER2 gene amplification despite a mean HER2 copy number of fewer than 2 copies per cell Image 2E. However, a recent audit by our group suggests that the presence of up to 30% of cells with HER2/CEP17 ratios 2.20 or more have no impact on outcome.6
Interpretation.—This is a nonamplified tumor by HER2 ratio (HER2/CEP17). It is not clear whether there is a loss of an entire chromosome 17, as suggested for case 4, with a low-level duplication of HER2 or whether there is a specific loss of the pericentromeric region containing the CEP17 α-satellite in one chromosome. This is likely to be the result of a chromosome rearrangement and imbalance. Other possibilities (also seen in other solid tumors by cytogenetics) include the loss of one chromosome 17 with the formation of an isochromosome for the long arm of chromosome 17 and an unbalanced translocation with retention of the derivative chromosome containing 17q material and the HER2 locus. The presence of a small proportion (<30%) of low-level “amplified” cells is not regarded as significant and should not be reported. It has been suggested that cases exhibiting monosomy 17 are poor responders to trastuzumab,9 although this evidence is not conclusive.
Scoring Recommendation.—Because this is a low-level amplified case, at least 60 cells should be scored, as per UK guidelines.
Reporting Recommendation.—This case should be reported as nonamplified based on an extended count of at least 60 cells. A note could be appended as to the abnormality of CEP17 counts. The presence of small numbers of cells with ratios of 2.20 or more is not significant and should not be reported.
Research Recommendation.—Perform array CGH/multiplex ligation-dependent probe amplification (MLPA) to determine the number of copies of chromosome 17 and the HER2 gene amplification status.
Case 6
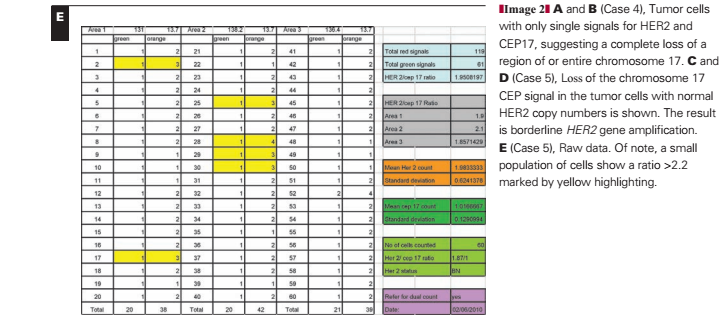
In this case Image 3A and Image 3B, the appearance of the CEP17 is comparable to that in case 5, suggesting a loss of 1 CEP17 signal in the tumor cell compartment (again with normal cells adjacent displaying a normal signal pattern). The loss or deletion extends only to the CEP17 signal; however, this case also shows an increase in HER2 copy numbers. The result is HER2 gene amplification with a mean HER2 copy number of 5.75 (SD, 0.9) and a mean CEP17 copy number of 1 (SD, 0.0); the HER2/CEP17 ratio is 5.75.
Interpretation.—This is a clearly amplified tumor by HER2 ratio (HER2/CEP17). It is not clear whether there is a loss of an entire chromosome 17, as suggested for case 5, with amplification of HER2 on the remaining chromosome or whether there is a specific loss of the pericentromeric region containing the CEP17 α-satellite in 1 chromosome. If the latter were correct, this category could include cases without true amplification. However, our current opinion is that this represents a reduction to monosomy of chromosome 17 with HER2 amplification on the retained chromosome or additional copies of HER2 due to a highly complex karyotype resulting in multiple copies of the long arm of chromosome 17.
Image2
Scoring Recommendation.—There is no evidence that scoring additional cells will alter the diagnosis. Score a minimum of 20 cells according to the guidelines.
Reporting Recommendation.—This case should be reported as HER2 gene–amplified, with the HER2/CEP17 ratio reported. A note should be appended as to the abnormality of CEP17 counts.
Research Recommendation.—Array CGH/MLPA could be performed to determine the number of copies of chromosome 17 and the HER2 gene amplification status. CGH would be required to discriminate between the scenarios described.
Case 7
In this case Image 3C and Image 3D, there is a total loss of all CEP17 signals in the tumor cells; note the presence of CEP17 in normal cells, which is an essential control. Only when normal cells demonstrate CEP17 signals can a clear diagnosis of loss of CEP17 be made. If there are no CEP17 signals in the normal cells, then there is a technical failure in the ISH assay. This is a challenging case because there is no CEP17 on which to base the HER2/CEP17 ratio. The HER2 mean copy number is 6.8 copies per cell (SD,1.78).
Scoring Recommendation.—Score the HER2 copy number in tumor cells. There is no evidence that scoring additional cells will alter the diagnosis. Score a minimum of 20 cells according to the guidelines.
Image 3


Interpretation.—UK guidelines recommend the use of CEP17 for all cases and do not recommend the use of single-copy FISH. None of the large phase 3 trials of trastuzumab reported results by copy number, and our own research suggests that copy number is an extremely poor guide of HER2 gene amplification.10However, in rare cases when the pericentromeric region of the chromosome is lost, we recommend reporting cases with a copy number of 6 or more as HER2-amplified with deletion of the CEP17 region. This is not regarded as the optimal approach and should not, based on previous evidence,10 be extended to cases in which CEP17 can be reported. However, in these specific cases, the analysis of CEP17 is not currently an option.
Reporting Recommendation.—Report the case as amplified on the basis of HER2 gene copy number alone (only if ≥6 copies of HER2/cell). Include a note to explain the loss of the CEP17 signal in all cells.
Research Recommendation.—Performing array CGH/MLPA would enable clarification of the genetic lesion leading to the absence of the CEP17 signal and define the existence or absence of HER2 gene amplification status. FISH analysis using alternative chromosome 17 probes (telomeric probes) may also be of value.
Coamplification of HER2 and CEP17
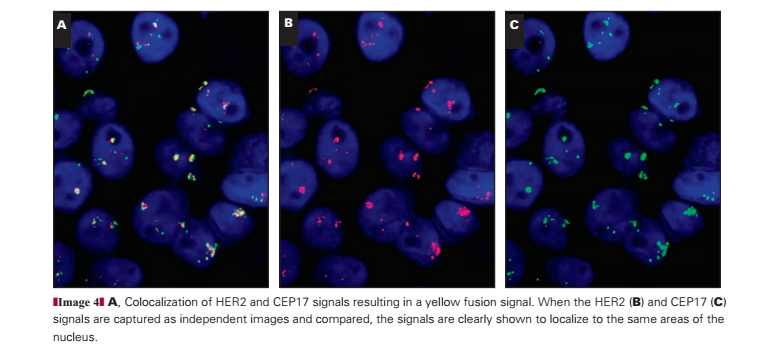
Although rare, coamplification of HER2/CEP17 is a topic of significant debate in the diagnostic community. Only 2 (0.1%) of 1,787 cases showed “colocalization” of the HER2 and CEP17 signals in the current audit Image 4. Colocalization of CEP17 and HER2 is observed when the HER2 (red; Image 4B) and CEP17 (green; Image 4C) FISH signals overlap to produce a yellow “merged” signal (Image 4A). This is a rare occurrence, thought to reflect coamplification of the CEP17/HER2 signals. However, a larger number of cases, 22 (1.2%), showed high copy numbers of HER2 (≥6 copies per cell) with duplication of CEP17 signals such that the overall HER2/CEP17 ratio did not exceed 2.0. The interpretation of these cases remains difficult with little evidence to support diagnosis; at present, we have interpreted balanced duplication of HER2/CEP17 (≥6 signals for HER2/CEP17 with ratios near 1) as evidence of coamplification.
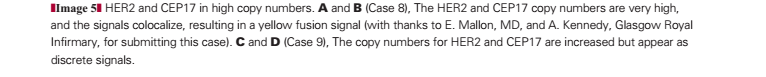
Case 8
This case Image 5A and Image 5B shows a signal pattern in which the large numbers of HER2 and CEP17 signals colocalize within the cell, resulting in a merged red and green signal that appears yellow when visualized with a triple bandpass filter. Under high power, evidence of overlapping red/green signals can be discerned (Image 5B). By using single bandpass filters, the colocalization of the signals can be confirmed (Image 4) and artifact (which fluoresces across all bandwidths) excluded. This case is difficult to interpret because the HER2/CEP17 ratio is 1.04, which is not amplified by conventional criteria, with comparable numbers of both signals with average counts for HER2 and CEP17 of 24.3 and 23.43, respectively. Nevertheless, these high counts for HER2/CEP17 mean that the case is highly abnormal.
Interpretation.—This case is unusual in that although the HER2/CEP17 ratio is not amplified, there are very high copy numbers of HER2 and CEP17. Given evidence of the differing extent of the HER2/CEP17 amplicon,11 we believe that these cases may represent extensions of the HER2 amplicon to include the pericentromeric CEP17 locus. Our opinion is that these rare cases should be interpreted as amplified. The signal pattern seen can be explained by the HER2 amplicon extending toward the centromere and incorporating part of the pericentromeric region, resulting in colocalization of the CEP17 signal with that of the HER2. Preliminary evidence has suggested that patients with extended HER2 amplicons may exhibit reduced response to trastuzumab12; however, this hypothesis has not been further tested.
Scoring Recommendation.—Score HER2 and CEP17 signals under single-color filters, taking care to match cells within fields to ensure accurate counting of red and green signals. Count a minimum of 20 cells according to the guidelines; counting additional cells is not likely to alter the diagnosis.
Reporting Recommendation.—This case should be reported as amplified with coamplification of the centromere based on the HER2 copy number and associated balanced CEP17 copy number, with colocalization of the HER2 and CEP17 signals noted in the report.
Research Recommendation.—A series of these cases should be subjected to array CGH/MLPA to test the hypothesis that these cases represent coamplification of the CEP17 and HER2 loci.
Case 9
This case Image 5C and Image 5D shows high copy numbers of HER2 and CEP17 but as nonoverlapping discrete signals. The HER2/CEP17 ratio is not amplified (1.12); however, mean copy numbers for HER2 and CEP17 are elevated, 7.45 and 6.65, respectively.
Interpretation.—Interpretation in this case seems straightforward in that the HER2/CEP17 ratio is not amplified; however, the HER2 and CEP17 signals show high copy numbers. The HER2 copy number is 6 or more, which is often, but not uniformly, associated with HER2 amplification,10 and by a copy-number-only method would be considered as amplified. From a genetic perspective, the underlying mechanism for the apparently balanced increase in HER2 and CEP17 copy numbers to this level is unclear but is unlikely to reflect multiple intact copies of chromosome 17.13 The challenge is that because uncertainty exists as to the true molecular mechanisms underlying these cases, there is significant room for diagnostic error in overinterpreting or underinterpreting the FISH results. In the absence of clear evidence (such as seen when HER2/CEP17 signals colocalize) that the HER2/CEP17 signals are coamplified, it is difficult to assume this represents true HER2 amplification. It is possible that, in fact, these cases represent a mixture of cases with subchromosomal duplication, and, potentially, a small proportion of these cases may be truly amplified. However, at present, there is insufficient evidence to suggest these cases may benefit from treatment.
Scoring Recommendation.—Score the HER2 and CEP17 signals, and count a minimum of 20 cells according to the guidelines.
Reporting Recommendation.—This case should be reported as not amplified in keeping with current guidelines. A comment on the high HER2 and CEP17 copy numbers should be included in the report.
Research Recommendation.—Array CGH or MLPA should be performed on a series of cases to determine the underlying genetic mechanism in these cases and whether they represent amplification of HER2. Additional work could look at quantitative polymerase chain reaction for HER2 messenger RNA to confirm gene amplification status.
Discussion
An audit of cases during 2 years in which ISH was performed from the Birmingham Heartlands Hospital supports evidence11,14,15 that unusual patterns of HER2 gene amplification are not uncommon and provide significant diagnostic challenges. We identified 171 (9.6%) of 1,787 FISH cases (all of which were referred owing to equivocal or 2+ immunohistochemical staining) with heterogeneous amplification (3.6%), CEP17 monosomy (2.6%), or deletion of HER2 (2.3%). Within some of these categories, a range of amplified or nonamplified results were obtained. Because this population was selected on the basis of equivocal immunohistochemical staining (2+) according to the current testing approach used in the majority of laboratories, we do not have robust information on the frequencies of these abnormalities within immunohistochemically negative (0/1+) or immunohistochemically positive (3+) HER2 cases. However, the treatment of such cases is currently determined without reference to ISH testing.
We recently completed an extensive audit of more than 6,000 cases of breast cancer, with clinical outcome data available for more than 50% of cases,6 that showed that the presence of individual cells with HER2/CEP17 ratios of more than 2.20 is a poor mechanism for the identification of clinically relevant heterogeneity of HER2 amplification within breast cancers. On the basis of this study, we made the following recommendation for the analysis of breast cancers and the identification of cases with heterogeneous amplification:
In all cases in which ISH is performed, the entire slide should be scanned before counting, and areas of apparent heterogeneity should be identified during this scan and/or by reference to an immunohistochemically stained slide. The number of CEP17 and HER2 signals should be counted in 20 to 60 nonoverlapping invasive cancer cell nuclei using at least 3 distinct tumor areas. If there is evidence of heterogeneity between areas (or less frequently within areas), additional cells (at least 20 per area) and/or areas (up to 6) should be counted. The HER2/CEP17 ratio should be calculated for each area individually. When the mean HER2/CEP17 ratio in any area is 2.00 or more, the tumor should be regarded as amplified. Cases containing amplified and nonamplified areas (using this definition) should be reported as exhibiting heterogeneous amplification. For all cases in which the ratio is between 1.80 and 2.20, results should be based on counting at least 60 tumor cells, and in cases in which heterogeneity is suspected, this should be 60 cells per area. In rare cases in which amplified and nonamplified tumor cells are intermingled in a single area, interpretation is difficult and evidence is lacking. We suggest that for such cases, only the presence of clearly amplified cells, with multiple HER2 signals, is considered evidence of heterogeneity, although evidence is lacking in this area. Current evidence does not support using the existence of small numbers of apparently amplified cells within an individual tumor area to identify heterogeneous amplification.
Other relatively common alterations that may affect the diagnosis of HER2 amplification include deletion of subchromosomal regions that may include the CEP17 and/or HER2 gene. Loss of both loci, through loss of the entire chromosome or microdeletions is intriguing but not overly challenging diagnostically. Likewise, loss of the HER2 region without loss of CEP17 will not pose a risk of misdiagnosis. Loss of the CEP17 region without loss of the HER2 gene locus could, in theory, lead to a false diagnosis of HER2 gene amplification. Discriminating between cases with monosomy of chromosome 17 and HER2 amplification on the residual chromosome and cases with loss of CEP17 but retention of HER2 is challenging and probably beyond the scope of conventional HER2 ISH technologies. This is particularly likely in cases in which no detectable CEP17 signals are observed despite the presence of multiple copies of HER2 in tumor cells and the presence of normal CEP17/HER2 signals in nontumor cells. Given the potential for misdiagnosis of HER2 amplification in the absence of CEP17 highlighted by our recent audit,10 this may represent a particular research priority. Further research into the cytogenetic karyotypes that underlie these cases is warranted to refine our understanding and potentially modify future diagnostic practice.
We identified only a very small number of cases (0.1%) with apparent coamplification of the CEP17 and HER2 signals, although a larger number exhibited high HER2 and CEP17 copy numbers, which raises suspicions regarding these cases. Despite the small number of cases in this category (about 1% of cases with equivocal immunohistochemical results), they generate, rightly, a significant amount of discussion in the field. The true biologic definition and consequences of coamplification in the context of HER2 and CEP17 is unclear, and this makes the basis for reporting guidelines for these cases, at present, a matter of expert opinion. Clearly, there is a need for rapid progress in research in this area. The HER2 amplicon is complex and can extend to the telomere and centromere; it also may involve a series of complex amplifications and deletions11 It is thus possible that the amplicon could extend into the pericentromeric region where the CEP17 probe binds. In this situation, the HER2 and CEP17 probes seem to colocalize, resulting in a yellow signal. Visualization on single bandpass filters confirms the localization of the HER2 and CEP17 signal to the same position. This colocalized signal pattern is rare, being observed in fewer than 1% of cases.
Recent evidence from MLPA and array CGH raises the possibility of another type of coamplification,14 in which a “firestorm” pattern has been demonstrated representing a series of complex losses and gains on the q arm of chromosome 17. In such situations, it would be possible to get separate amplification of the HER2 and CEP17 signals, resulting in increased copies of both without colocalization. This would previously have been considered as representing high-level chromosome 17 “polysomy”; however, it may also represent subchromosomal duplication with or without HER2 amplification.
Our data suggest that almost 1 in 10 breast cancers referred for HER2 ISH testing (owing to equivocal immunohistochemical results) exhibit ISH patterns that may be challenging to diagnose and report. Evidence-based guidelines are now available for the assessment of heterogeneous HER2 amplification and the importance of CEP17 copy number.6,10 However, for some cases, particularly when deletion of CEP17 is suspected, diagnostic recommendations are currently based on expert opinion rather than clear evidence. We have provided information on the recommended diagnosis for cases with equivocal HER2 ISH patterns with clear recommendations for determining if cases are amplified or not. While we recognize the importance of a harmonized approach to such cases, there is a clear need for additional research to support or refine expert opinion.
References